Reports and analytics
Restaurant Reports and KPIs Every Owner Should Track
Which restaurant reports and KPIs to review daily, weekly and monthly: average check, profit report, menu engineering and table turnover, with AZN examples.
UniPOS11 min read
Many owners ask the register for a single number at the end of the day: how much did we sell? That number matters, but it says little about the actual state of the business. The same 3,000 AZN in sales can produce a profit one day and a loss the next. The difference sits in discounts, complimentary items, deleted orders, payroll and the mix of dishes that were sold.
This article explains, step by step, which reports a restaurant or cafe owner should review every day, every week and every month. Each metric comes with a formula and a worked example in AZN. The figures are illustrative, but the method applies to any venue. Food cost and recipe costing are covered in a separate article: restaurant inventory and food cost control.
Contents
- Core sales metrics
- How to calculate the average check
- Sales by hour, area, category and server
- Payments, discounts, comps and voids
- Calculating restaurant profit
- Menu engineering and the four item groups
- Table turnover and revenue per table
- Daily, weekly and monthly review
- Common mistakes when reading reports
- Reports in UniPOS
Core sales metrics in restaurant reports
Every report is built on a handful of base metrics. Everyone on the team should define them the same way. Otherwise the manager and the accountant will describe the same day with different numbers.
- Gross sales. The total of all items sold at menu prices, before discounts.
- Net sales. Gross sales minus discounts and refunds. This is the main figure for analysis.
- Check count. The number of checks closed with payment. Voided checks and checks closed without payment are counted separately.
- Guest count. The number of guests the server records on the check. Without it, per-guest metrics cannot be calculated.
- Service charge. A percentage added to the check. It is not menu revenue and should appear on a separate line.
Decide in advance how service charge is treated. If it is shared among the servers, it is not the venue's revenue. Adding it to sales inflates both the average check and the margin. The same principle applies to VAT: analysis should be based on figures excluding VAT. This is discussed further in the section on common mistakes.
How to calculate the average check and sales per guest
The average check shows the typical value of one check. Sales per guest shows how much one guest spends on average. The two should always be tracked together.
Average check = net sales ÷ number of closed checks
Sales per guest = net sales ÷ guest count
Guests per check = guest count ÷ check count
Here is an illustrative day:
| Metric | Calculation | Result |
|---|---|---|
| Gross sales | 3,400 AZN | |
| Discounts | 160 AZN | |
| Net sales | 3,400 − 160 | 3,240 AZN |
| Closed checks | 120 | |
| Guest count | 300 | |
| Average check | 3,240 ÷ 120 | 27.00 AZN |
| Sales per guest | 3,240 ÷ 300 | 10.80 AZN |
| Guests per check | 300 ÷ 120 | 2.5 |
When the average check moves, find out why before drawing conclusions. Suppose that next week the average check rises to 30.00 AZN while sales per guest stays at 10.80 AZN. Guests are not spending more. There are simply more people at each table: guests per check has gone from 2.5 to roughly 2.8. If sales per guest rises, guests are either ordering more or paying higher prices. To tell these apart, check portion counts in the product report.
Calculate the average check separately for each sale type. Dine-in, takeaway and delivery checks differ considerably. When they are combined, small lunchtime takeaway checks pull down the dining room's average and distort the picture.
Restaurant sales report by hour, area, category and server
The total tells you what happened. The breakdown tells you where and when it happened.
Sales by hour
| Hours | Checks | Sales (AZN) | Average check (AZN) |
|---|---|---|---|
| 12:00-15:00 | 38 | 760 | 20.00 |
| 15:00-18:00 | 14 | 310 | 22.14 |
| 18:00-21:00 | 46 | 1,450 | 31.52 |
| 21:00-24:00 | 22 | 720 | 32.73 |
| Total | 120 | 3,240 | 27.00 |
The evening accounts for 57% of checks and 67% of sales. Lunch brings plenty of checks, but the average is far lower. Between 15:00 and 18:00 only 14 checks were closed. Compare the number of staff on shift during those hours with the sales they produced. Decisions about the staff rota, a business lunch offer or an afternoon promotion should be based on a table like this one.
Dining areas and sale types
The main hall, the terrace, a private room and takeaway each have their own average check and their own costs. If the terrace only opens in warm months, comparing it with the main hall for the rest of the year makes little sense. Track sales and check counts for each area separately. If different areas carry different service charges, the reports should show that as well.
Categories
The split between food, drinks and desserts shows how the menu actually sells. Drinks are usually a high-margin category. When their share drops, the cause is often that servers have stopped suggesting them. Desserts are tracked the same way.
Servers
Comparing servers by total sales is misleading, because the total depends on how many shifts they worked and where. Better measures are the average check, sales per guest, items per check and the volume of discounts and voids. Compare servers working the same area at the same hours. A server on the evening terrace will always have a higher average check than a colleague handling daytime takeaway.
Payment types, discounts, comps, voids and refunds
These figures are about control rather than growth. Review them daily, because a week later nobody remembers the details of a transaction.
Cash and card
On our example day, 2,100 AZN of the 3,240 AZN (64.8%) was paid by card and 1,140 AZN (35.2%) in cash. At shift close, cash is counted against the drawer and card payments are matched with the bank terminal report. If a check was paid with two methods, each part must be recorded under its own payment type. Remember bank fees too. At an assumed fee of 1.5%, 2,100 AZN in daily card sales costs 31.50 AZN a day, or about 950 AZN a month. That amount belongs in the profit report as an expense.
Discounts
In the example, discounts are 160 ÷ 3,400 = 4.7% of gross sales. Discounts themselves are not a problem; uncontrolled discounts are. For every discount the report should show who gave it, on which check and on what grounds. Keep automatic customer-group discounts separate from discounts a server applies manually.
Comps
A comp is an item served free of charge. It produces no revenue, but it still leaves the stockroom. Record it at the register as a comp. Otherwise stock usage will not match sales, and the loss will show up as an unexplained variance. Value comps at cost and track them monthly as a marketing expense.
Voids and refunds
Items deleted after being sent to the kitchen, voided checks and refunds on closed checks deserve the closest attention. Each one should carry a reason: the guest changed their mind, the order was entered incorrectly, the dish was spoiled. Group these transactions by employee in the daily report. Watch for voids that repeat with the same person, cluster at the end of a shift or happen after the guest bill has been printed. If the pattern persists for several weeks, it is no longer a coincidence.
Restaurant profit calculation and how to read a profit report
The formula is simple: profit is revenue minus expenses. The difficulty lies in the details: which revenue, which expenses and which month they belong to. Here is an illustrative month, with revenue shown excluding VAT and service charge.
| Line | Amount (AZN) | % of sales |
|---|---|---|
| Net sales (excl. VAT) | 76,000 | 100% |
| Cost of food and beverages | 24,300 | 32.0% |
| Gross profit (76,000 − 24,300) | 51,700 | 68.0% |
| Payroll (incl. taxes and social contributions) | 20,500 | 27.0% |
| Rent | 10,000 | 13.2% |
| Utilities | 3,400 | 4.5% |
| Bank fees, software, marketing and other | 5,100 | 6.7% |
| Total operating expenses | 39,000 | 51.3% |
| Operating profit (51,700 − 39,000), before profit tax | 12,700 | 16.7% |
Three key figures come out of this table:
- Gross profit (gross margin). Only the cost of goods is deducted from sales. 68.0% means that 68 qapik of every manat in sales is left to cover payroll, rent and everything else.
- Labor cost percentage. Payroll ÷ net sales × 100 = 20,500 ÷ 76,000 × 100 = 27.0%. Payroll changes little with sales, so this share rises in slower months.
- Prime cost. Cost of goods plus payroll: 24,300 + 20,500 = 44,800 AZN, or 58.9% of sales. These are usually the two largest expenses and the ones a manager can influence directly.
Read the profit report in this order:
- Check the revenue line. Make sure it excludes VAT, shows service charge separately and has refunds deducted.
- Compare the cost of goods. Compare this month's share with last month and with the theoretical food cost from your recipe cards. If the gap has grown, look for the cause in the stockroom.
- Look at the labor share. If it went up, first check whether sales went down, then look at overtime and new hires.
- Assign expenses to the month they belong to. If three months of rent were paid at once, each month should carry one third. Otherwise one month looks like a loss and the next two look better than they were.
- Do not confuse profit with cash on hand. The register may hold plenty of cash while supplier invoices remain unpaid. Once those debts are settled, the picture changes.
The same table gives you the break-even point: the minimum monthly sales needed to avoid a loss. As a simplification, treat payroll, rent, utilities and other costs as fixed, and the cost of goods as variable. Break-even is then 39,000 ÷ (1 − 0.32) ≈ 57,350 AZN. Below that level, the month closes at a loss.
Menu engineering: sorting items into four groups
Menu engineering rates every item on two measures: how often it sells and how much margin each portion brings. Margin here is measured in manat, not percent: contribution margin = selling price − ingredient cost. That is the amount that pays for staff and rent.
Run the analysis over a month and compare similar items only. Main courses should not sit in the same table as drinks and desserts. The procedure:
- List monthly portions sold and the contribution margin for each item in the category.
- Calculate the popularity threshold. The usual rule is 70% of the average share per item. With 6 items and 2,000 portions, the average is 2,000 ÷ 6 ≈ 333 portions and the threshold is 333 × 0.7 ≈ 233 portions.
- Calculate the margin threshold. This is the weighted average margin: total margin ÷ total portions. In the example, 15,713 ÷ 2,000 ≈ 7.86 AZN.
- Assign each item to one of four groups based on the two thresholds.
| Item | Sold (portions) | Price (AZN) | Cost (AZN) | Margin per portion (AZN) | Total margin (AZN) | Group |
|---|---|---|---|---|---|---|
| Chicken kebab | 600 | 12.00 | 3.55 | 8.45 | 5,070 | Star |
| Chicken schnitzel | 410 | 11.00 | 2.80 | 8.20 | 3,362 | Star |
| Lula kebab | 520 | 11.00 | 4.40 | 6.60 | 3,432 | Plowhorse |
| Salmon steak | 140 | 26.00 | 11.00 | 15.00 | 2,100 | Puzzle |
| Dolma | 180 | 9.00 | 2.70 | 6.30 | 1,134 | Dog |
| Mushroom pasta | 150 | 7.00 | 2.90 | 4.10 | 615 | Dog |
| Total | 2,000 | 7.86 (avg.) | 15,713 |
Each group calls for a different decision:
- Stars (popular, high margin). Here, the chicken kebab and the schnitzel. Leave the recipe and portion alone, keep quality consistent and give them a prominent place on the menu.
- Plowhorses (popular, low margin). Here, the lula kebab. Guests like it, so removing it is risky. Raise the price in small steps, lower the cost of the side dish or pair it with a high-margin drink.
- Puzzles (unpopular, high margin). Here, the salmon steak. Each portion earns 15.00 AZN, but few guests order it. Move it to a better spot on the menu, rewrite the name and description and ask servers to recommend it.
- Dogs (unpopular, low margin). Here, the dolma and the mushroom pasta. These should be reworked or dropped. The exception is a dish central to the concept: in a restaurant built around Azerbaijani cuisine, removing dolma is probably the wrong call.
The salmon shows why food cost percentage alone is not enough. Its food cost is 11.00 ÷ 26.00 ≈ 42%, the highest in the table. Judged on percentage alone, it would look like a problem item. In fact it has the highest margin per portion; it simply does not sell enough. Repeat the analysis monthly and before every menu change. If costs come from outdated recipe cards, the groups will be wrong too.
Table turnover rate and revenue per table
Seating capacity is limited. How many times a table is used in an evening and how much revenue it brings show how well that capacity is used.
Table turnover = checks closed at tables ÷ number of tables
Revenue per table = dining room sales ÷ number of tables
Revenue per available seat hour = dining room sales ÷ (seats × opening hours)
Example: the dining room has 24 tables and 80 seats. Between 18:00 and 24:00, 60 table checks were closed and dining room sales reached 2,000 AZN. Table turnover is 60 ÷ 24 = 2.5, revenue per table is 2,000 ÷ 24 ≈ 83.33 AZN and revenue per seat hour is 2,000 ÷ (80 × 6) ≈ 4.17 AZN.
If guests wait for tables at peak times while turnover stays low, look at service speed: order taking, kitchen preparation time and how quickly the bill arrives. Also compare guests per check with table size. If six-seat tables usually host two guests, it may be time to rethink the floor plan. Calculate these figures for peak hours, not the whole day, because quiet hours drag the result down.
Daily, weekly and monthly report review
There is no need to open every report every day. The table below fits on a single page and can be printed for the manager's desk.
| When | What to review | Question to answer |
|---|---|---|
| Daily, at shift close | Net sales, check count, average check, cash and card split, cash variance, discounts, comps, voids, refunds, open checks | Does the cash in the drawer match the report? Are there voids or discounts without a reason? |
| Weekly | Comparison with the same weekdays last week, sales by hour, average check by server, best sellers, stock of expensive items | Does the staff rota match peak hours? Which day underperformed? |
| Monthly | Profit report, cost of goods and labor share, expense categories, actual versus theoretical food cost, menu engineering, supplier debts | Did the month close at a profit? Which expense grew, and what should change on the menu? |
Every review should end with a specific decision. For example: one fewer server on the Wednesday day shift, a higher price for the lula kebab or a monthly limit on comps. A review that leads to no decision is just time spent.
Common mistakes when reading restaurant reports
- Looking only at revenue. If sales grew but discounts, comps and cost of goods grew faster, profit falls. Always read revenue together with profit and margin.
- Mixing VAT in and out. If the business is VAT-registered and menu prices include 18% VAT (the rate in Azerbaijan), the month above shows up in the register report as 76,000 × 1.18 = 89,680 AZN. The 13,680 AZN difference is not profit; it is tax owed. Taking sales with VAT and expenses without it makes the margin look better than it is. Pick one rule and apply it everywhere.
- Comparing different weekdays. Friday will almost always beat Monday. Compare Friday with last Friday, and a month with the same month last year. Treat holidays such as Novruz week separately.
- Watching percentages and forgetting amounts. As the menu engineering example shows, a dish with a high food cost percentage can be your biggest earner. Look at margin in manat as well as in percent.
- Booking expenses by payment date. When rent, insurance or an annual software fee lands in one month, that month looks like a loss. Spread the expense over the periods it covers.
- Not recording guest count. If servers skip the guest count, sales per guest and table turnover cannot be calculated. Make entering it part of the standard procedure.
- Tracking too many metrics. A manager who looks at thirty numbers a day rarely acts on any of them. Start with the metrics in the table above and add more only when you need them.
Reports and KPIs in UniPOS
All of the metrics above can be calculated in Excel. That requires exporting register data in the same format every day and recording guest counts, discounts and voids separately. In UniPOS, this data is collected at the point of sale and shown in reports. Here is where to find each piece.
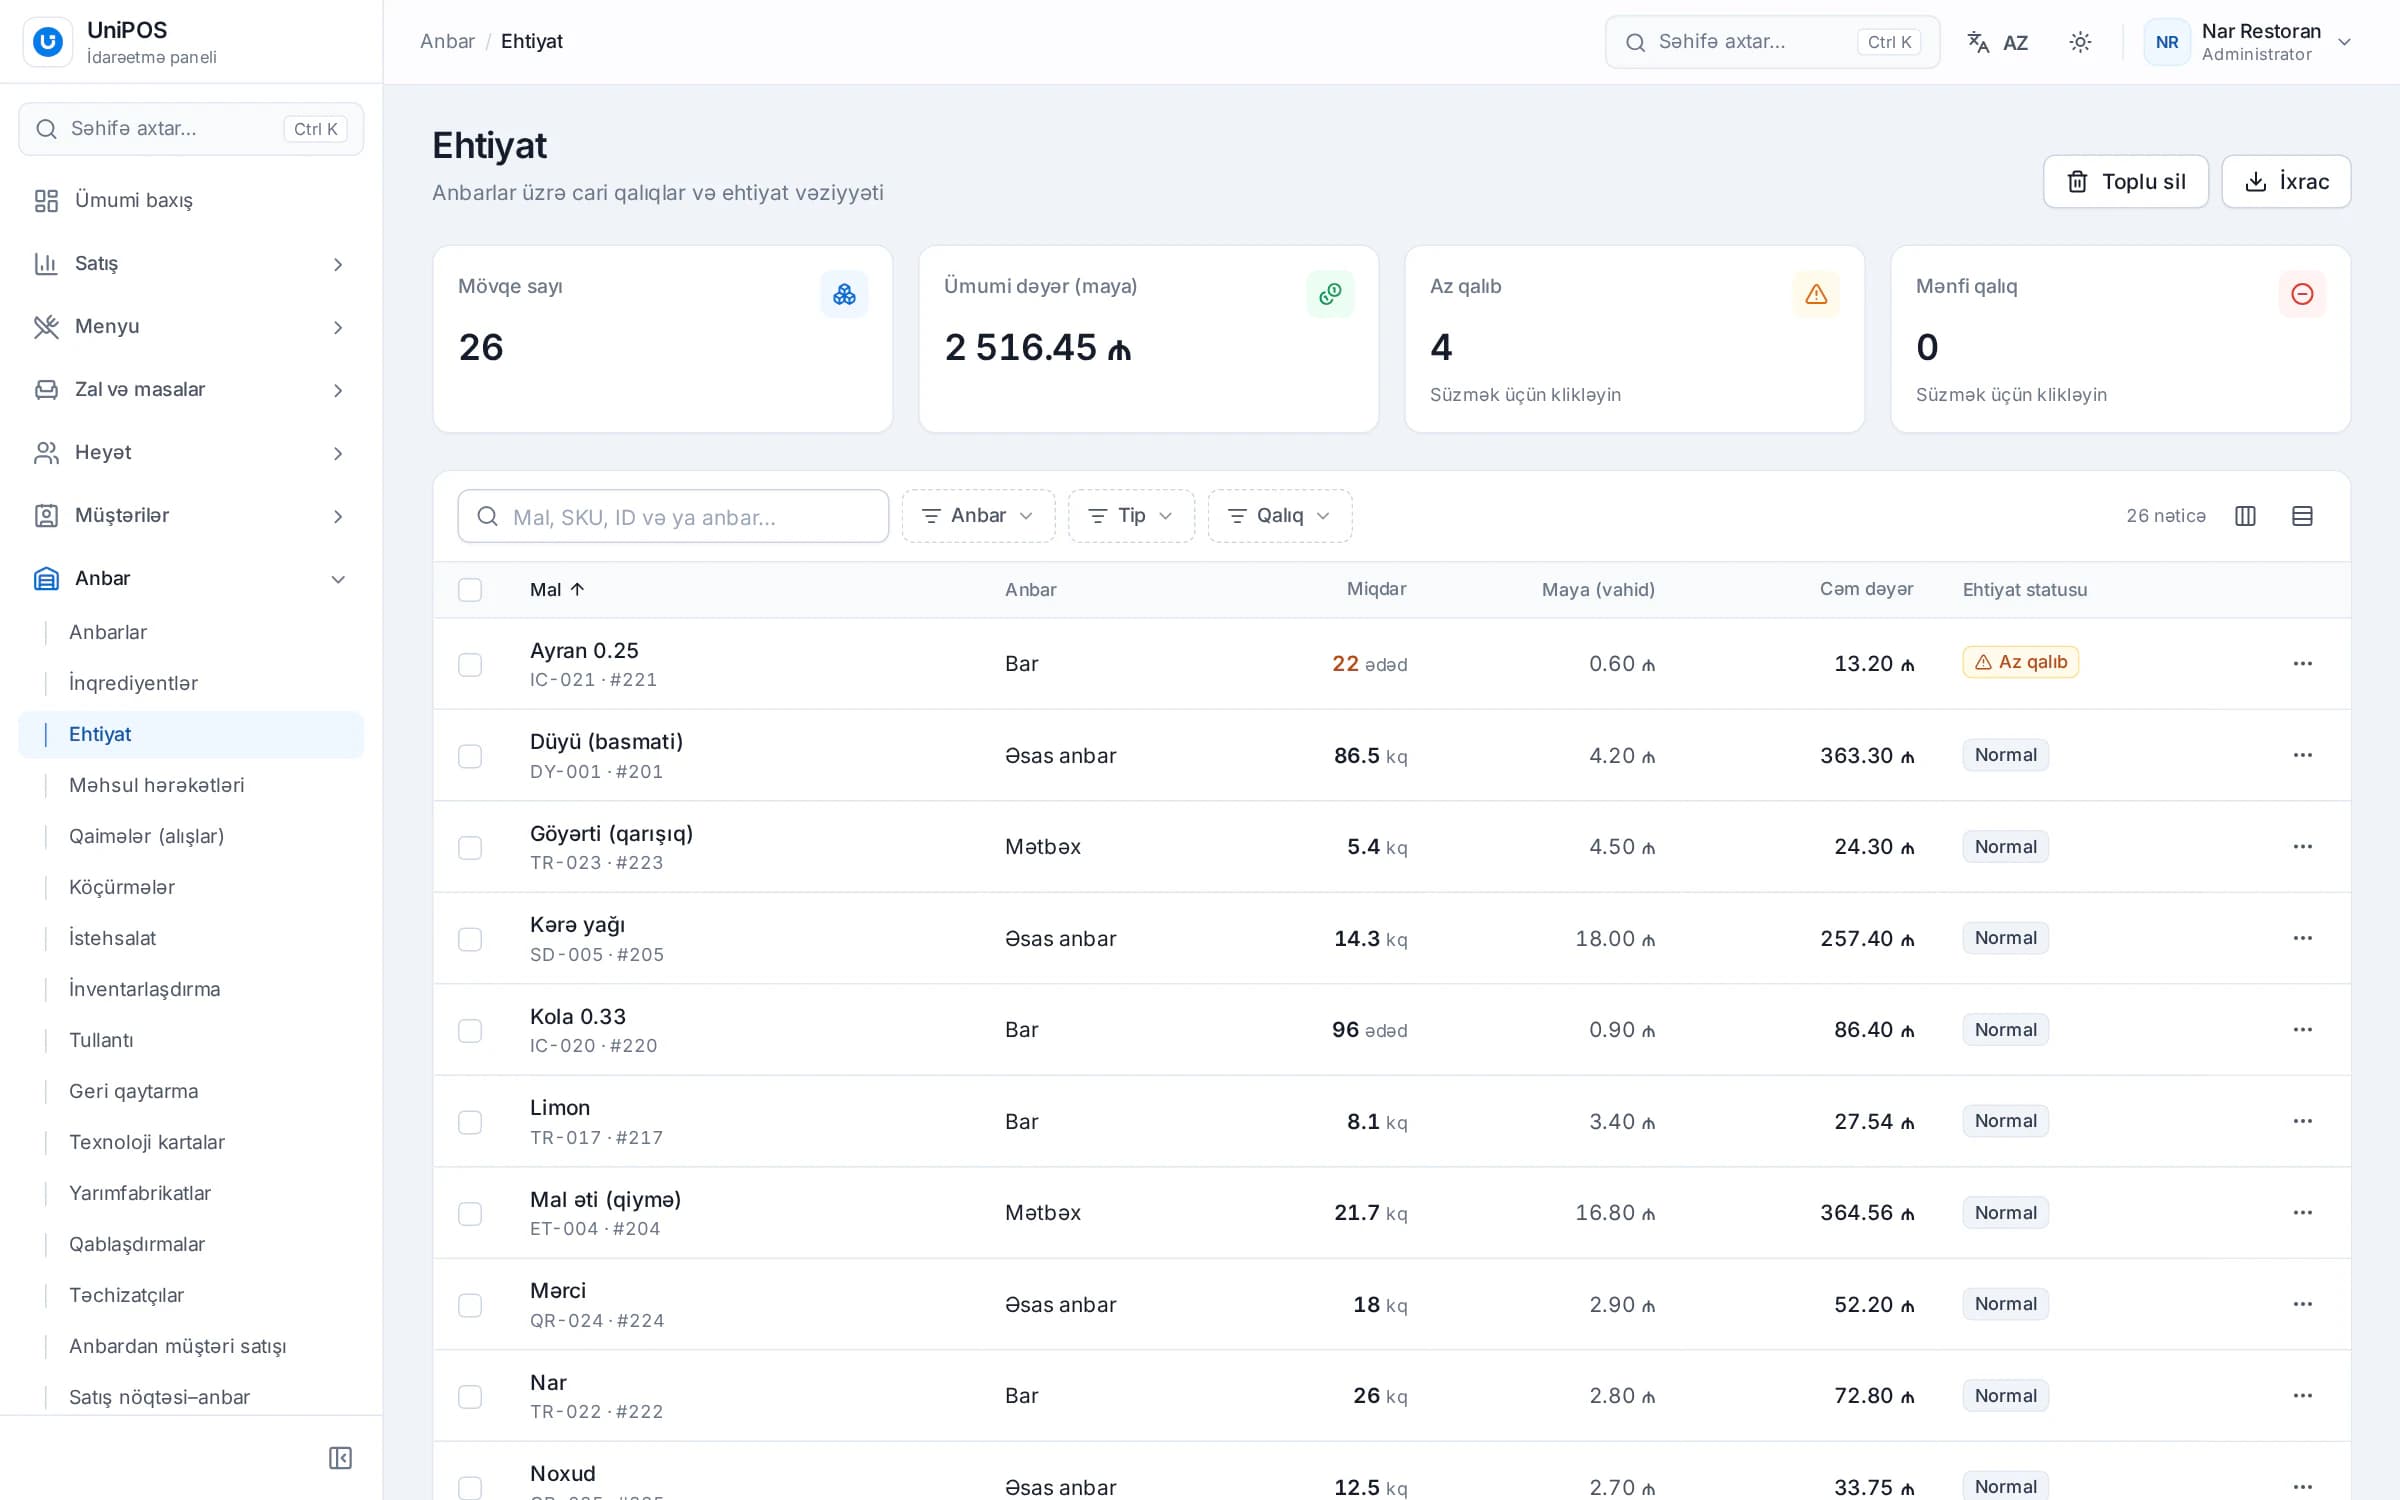
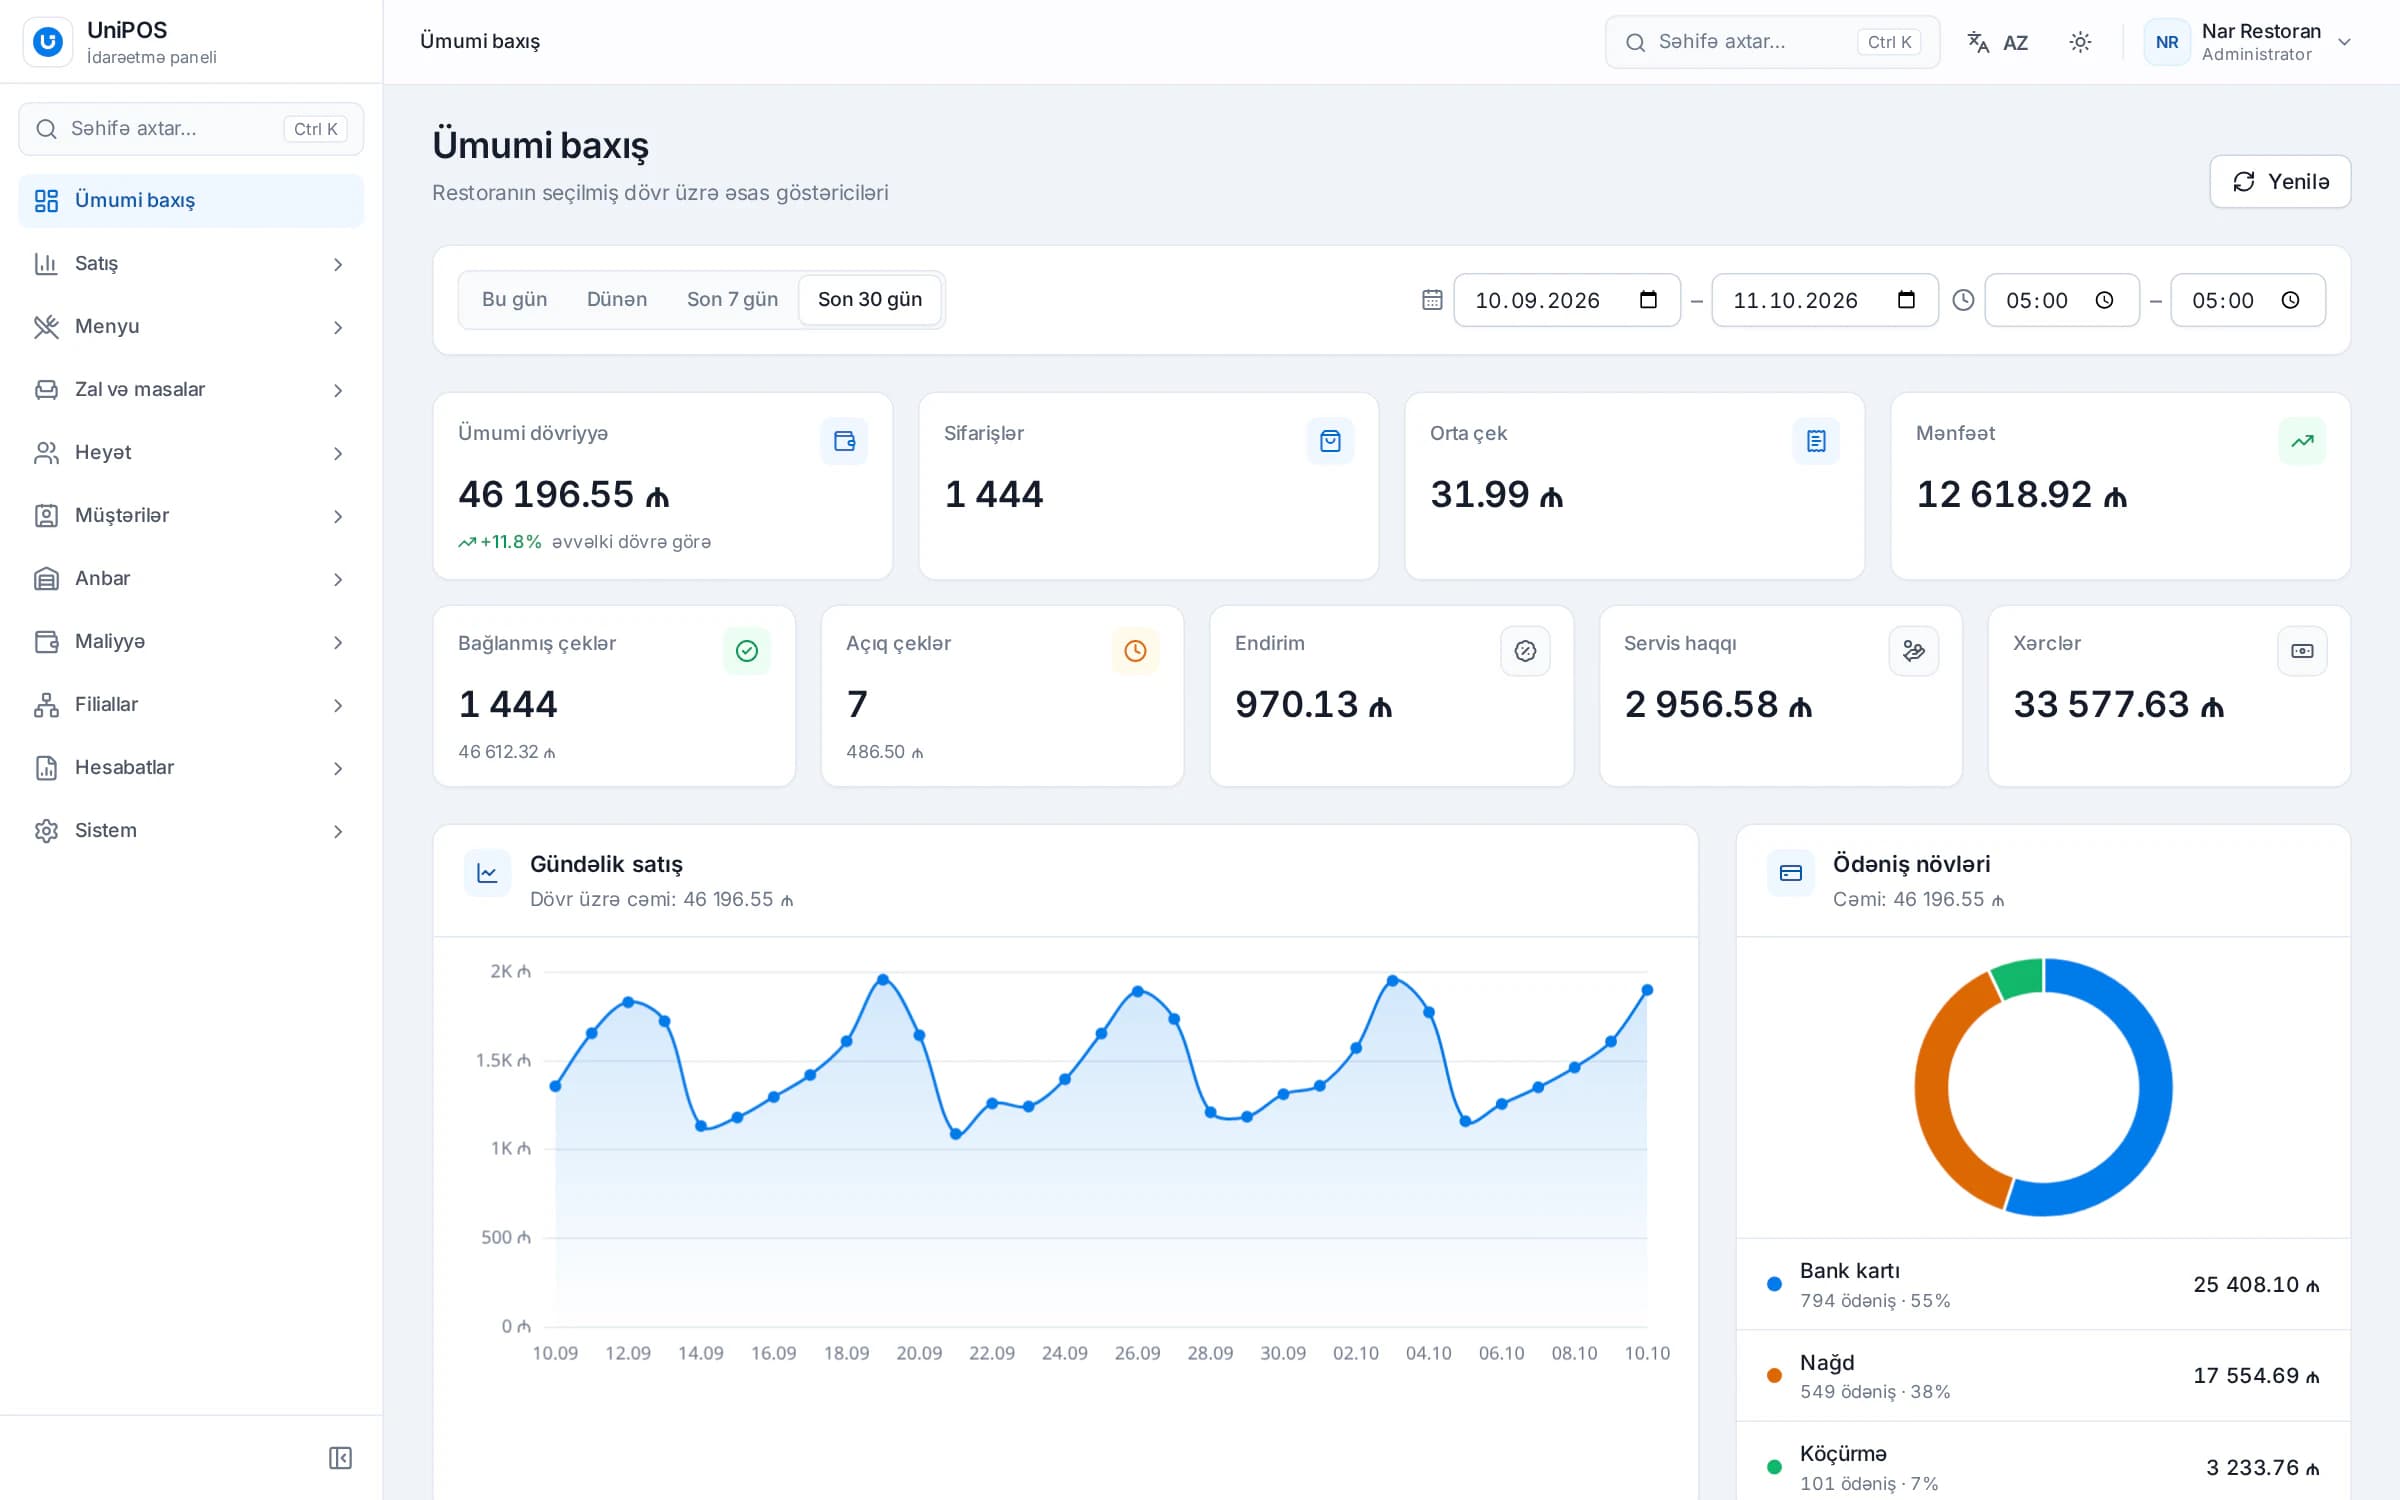
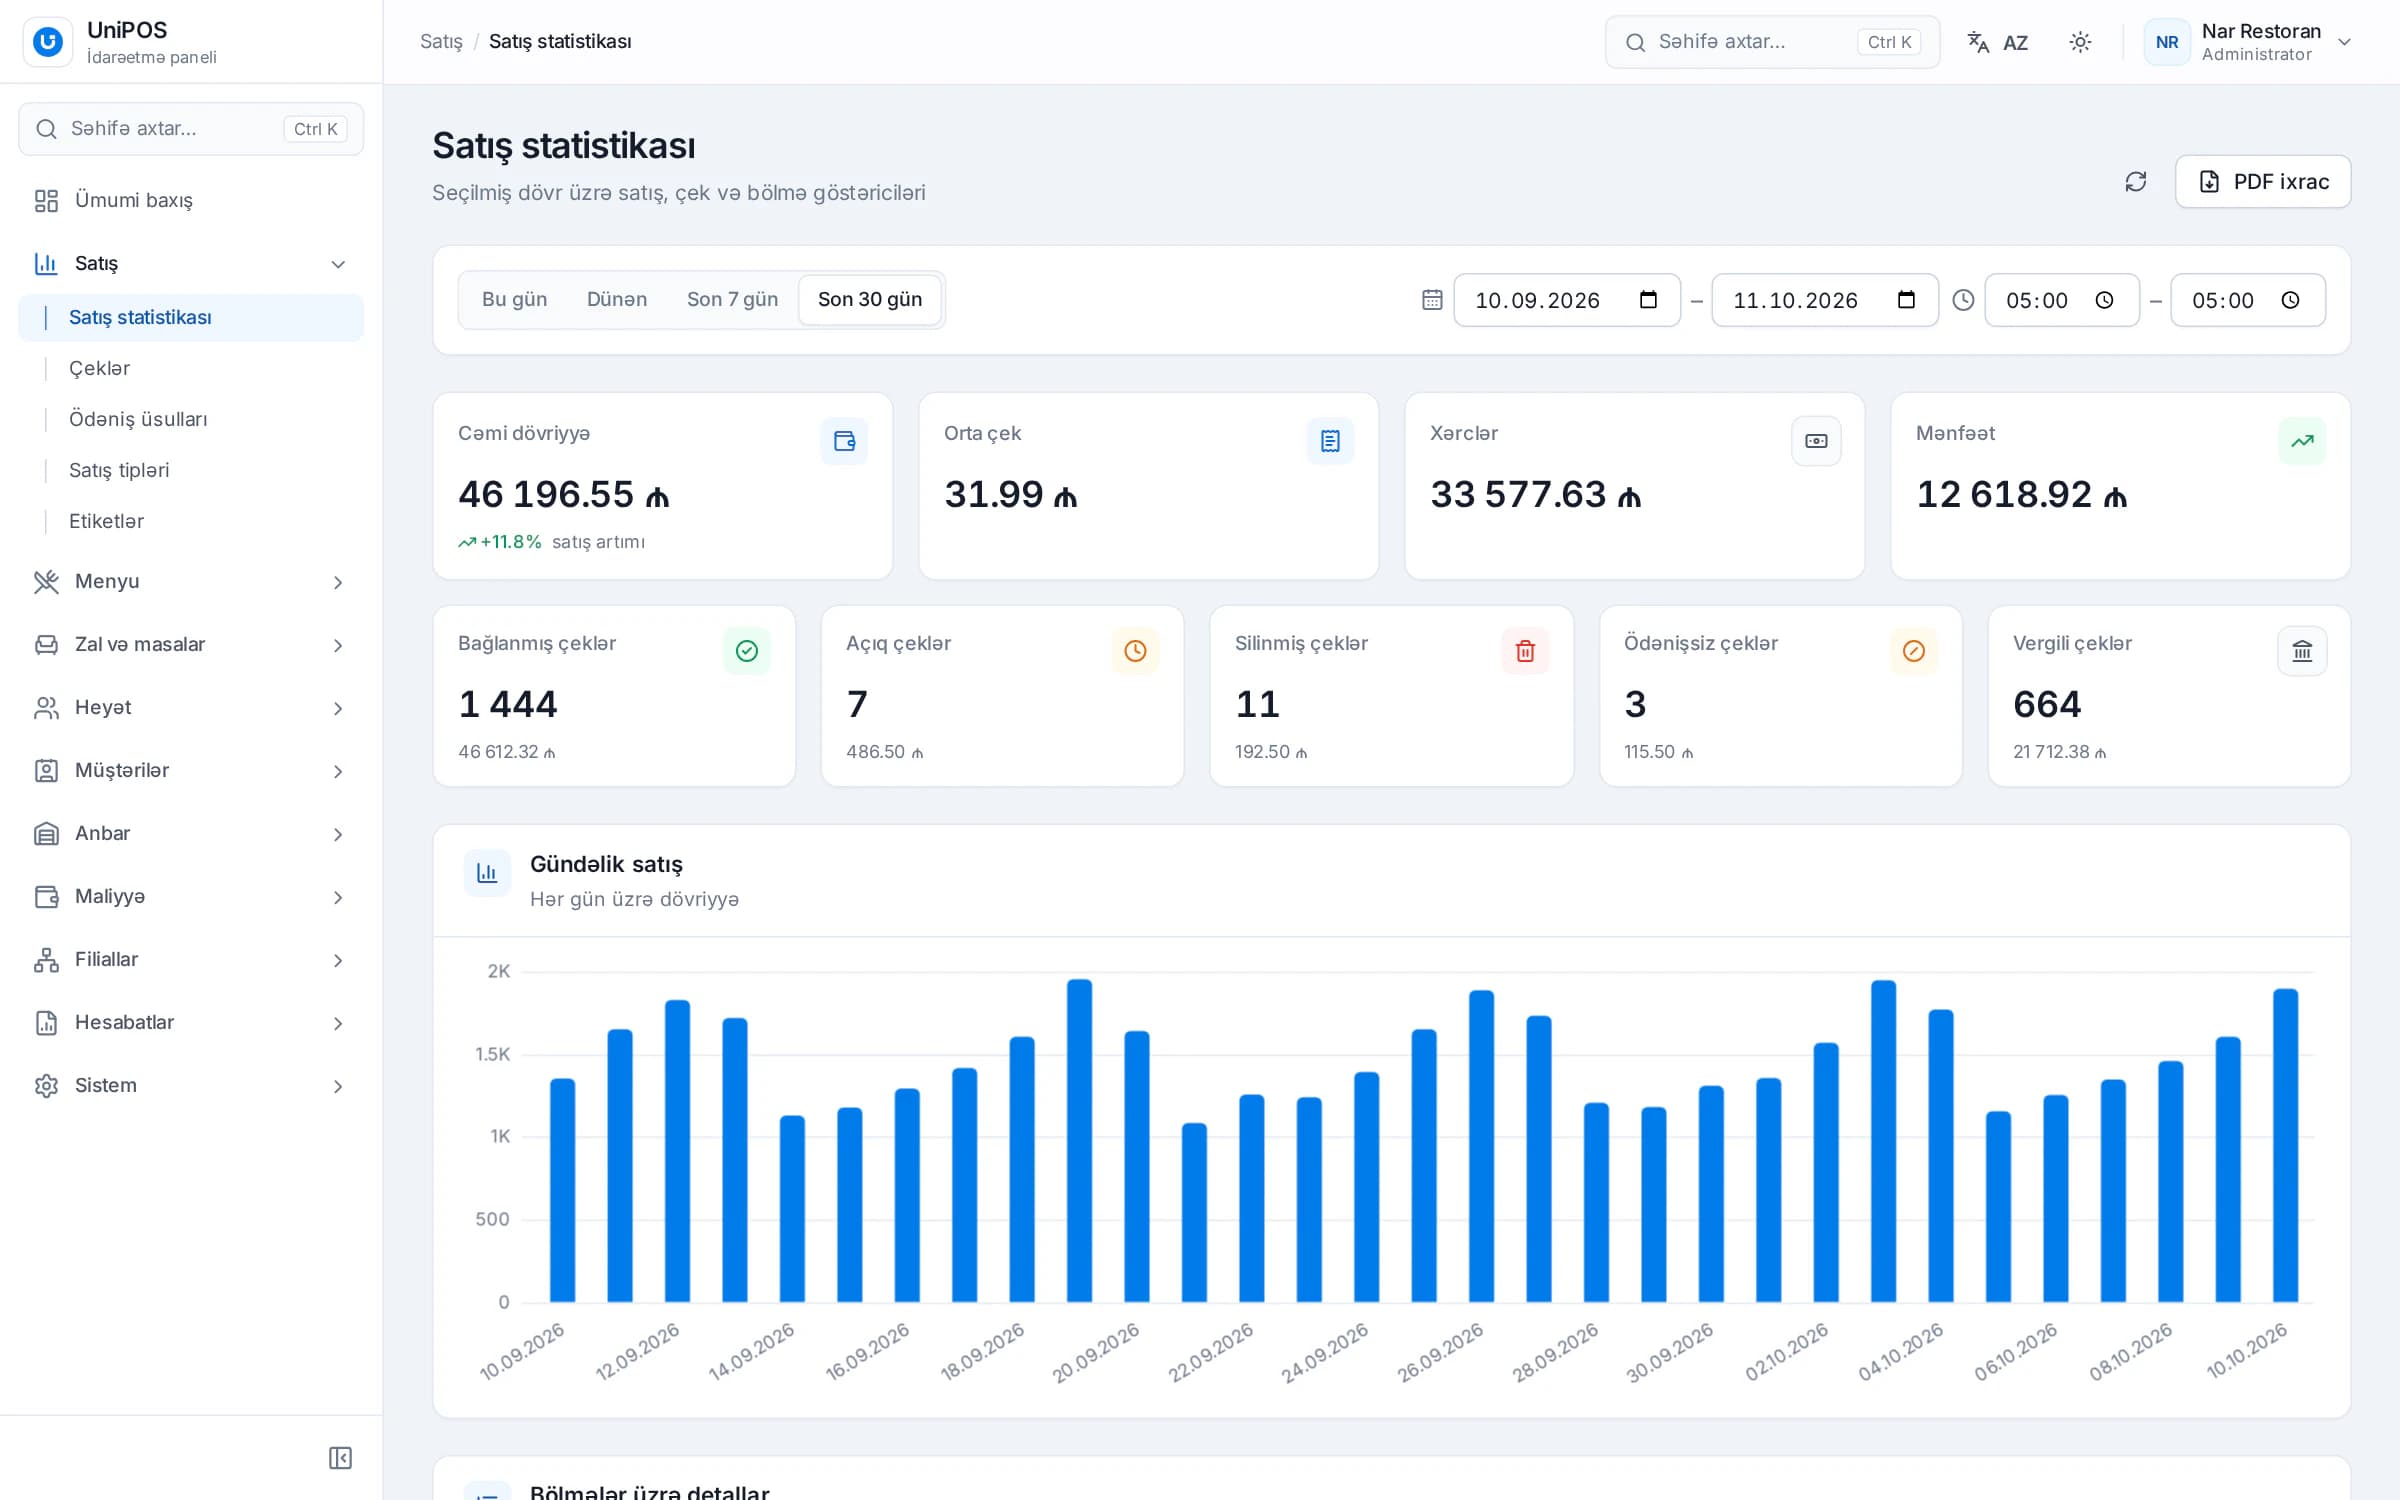
The back office dashboard has date, terminal and shift filters, so the daily review can be done right at shift close. More details are on the back office and POS system pages.
The UniPOS Manager app (Android) has a widget board built from 15 widget types and 17 reports. Widgets include a sales chart, payments, profit margin, expenses, deletions and a branch report, each with its own date and branch scope. Push notifications cover deletions and payments. The app shows the real cost and margin of menu items based on recipe cards and purchase prices, and flags items sold at a loss. Combined with portion counts from the product report, this gives you the inputs for a menu engineering table. With several branches, figures can be viewed per branch or for all branches together (multi-branch management).
With the separately enabled AI assistant module, you can ask questions in the app by text or voice, such as "Compare with yesterday" or "Sales by server". The assistant explains sales, expenses and menu engineering data but never changes anything in the system. Key figures should still be checked in the reports.
Your KPIs in UniPOS
During a demo, we will show how average check, profit and deletion reports work in UniPOS using sample data.
Request a demo