Inventory and food cost
Restaurant Inventory and Food Cost Control with Recipe Cards
How to calculate restaurant food cost, prepare recipe cards and identify inventory losses, with worked AZN examples and actual versus theoretical cost.
UniPOS9 min read
Restaurant owners often turn their attention to food cost only after a disappointing month. The dining room was full and sales at the register looked healthy, yet the monthly profit came in below expectations. In most cases the money is lost in the kitchen and the storeroom: purchase prices rise, portions grow, fresh herbs spoil and some movements are never recorded. Two instruments make these losses visible: an accurately calculated food cost and a recipe card for every dish.
All examples below are in AZN. The figures are illustrative but realistic for a restaurant in Baku. You can substitute your own prices; the calculation method remains the same.
Contents
What food cost is and how to calculate it
Food cost is the share of a dish's selling price that is spent on ingredients. In other words, it shows what part of every manat paid by a guest goes to raw materials. For a single dish the formula is as follows:
Food cost % = ingredient cost ÷ selling price × 100
A dish with an ingredient cost of 3.55 AZN sold for 12.00 AZN has a food cost of 3.55 ÷ 12.00 × 100 = 29.6%.
This figure is calculated separately for every menu item. To assess the business as a whole, food cost should also be calculated for a period, usually a week or a month:
Period food cost % = (opening stock + purchases − closing stock) ÷ food sales × 100
The expression in brackets is actual usage: the stock on hand at the start of the period, the purchases made during it and the quantity remaining at the stock count. The result is the real value of the ingredients consumed by the kitchen during that period.
There is no single benchmark for a normal food cost. It depends on the concept, the menu and the price segment. As a general guide, restaurants typically target a range of 25-35%. Coffee and tea usually carry a lower share, while meat and seafood carry a higher one. The key is to define your own target and monitor it every month. If your menu prices include VAT, decide once whether the calculation is made with or without VAT. Keep that rule unchanged afterwards; otherwise months cannot be compared with one another.
Gross weight, net weight and yield on a recipe card
A recipe card (also called a tech card or standard recipe) specifies how much of each ingredient goes into one portion. For the chef it is the working standard; for the owner it is the basis of cost calculation. Without recipe cards, food cost cannot be calculated accurately, and it is impossible to determine how much stock should have been deducted.
Every recipe card should distinguish three concepts:
- Gross weight. The weight taken from the storeroom before trimming. This is the weight you pay the supplier for.
- Net weight. The usable part that remains after peeling, deboning and trimming.
- Loss (yield) percentage. The difference between gross and net weight, expressed as a percentage. Net = gross × (1 − loss %).
If 15% of 0.060 kg of onion is peel and root, the net weight is 0.051 kg. The calculation also works in reverse. If a dish requires 0.270 kg of trimmed chicken and trimming loses 10%, the kitchen must take 0.270 ÷ 0.90 = 0.300 kg from stock. The most common error is costing a dish on net weight. The dish then appears cheaper on paper than it actually is.
Grilling, frying and boiling also reduce weight. This does not affect the cost, because the gross weight has already been paid for. It does, however, affect the finished portion weight stated on the menu. For components prepared in advance, such as sauces, dough or stock, create a separate semi-finished item card. Its cost is calculated once, and the item is then used as an ingredient in several dishes.
The cost of one chicken kebab portion
Below is a complete recipe card for one portion of chicken kebab. The cost of each line is calculated as gross weight × price per kg.
| Ingredient | Gross (kg) | Loss | Net (kg) | Price (AZN/kg) | Cost per portion (AZN) |
|---|---|---|---|---|---|
| Chicken thigh fillet | 0.300 | 10% | 0.270 | 9.00 | 2.70 |
| Onion | 0.060 | 15% | 0.051 | 1.50 | 0.09 |
| Tomato | 0.100 | 5% | 0.095 | 3.00 | 0.30 |
| Lavash | 0.050 | 0% | 0.050 | 4.00 | 0.20 |
| Spices and salt | 0.005 | 0% | 0.005 | 20.00 | 0.10 |
| Vegetable oil | 0.010 | 0% | 0.010 | 4.00 | 0.04 |
| Herbs and sumac | 0.020 | 10% | 0.018 | 6.00 | 0.12 |
| Total ingredient cost | 3.55 | ||||
| Selling price | 12.00 | ||||
| Food cost | 29.6% |
Each portion consumes 3.55 AZN of ingredients. This leaves a gross margin of 12.00 − 3.55 = 8.45 AZN, from which wages, rent and utilities are paid; the remainder is profit.
The following example shows why this table must be kept up to date. Suppose the price of chicken rises from 9.00 to 10.50 AZN/kg. The chicken line becomes 0.300 × 10.50 = 3.15 AZN. The total cost increases from 3.55 to 4.00 AZN, and food cost rises to 4.00 ÷ 12.00 = 33.3%. To return to 29.6%, the selling price would need to be approximately 13.50 AZN (4.00 ÷ 13.50 ≈ 29.6%). When purchase prices are not linked to recipe cards, this change is usually discovered at month end, after profit has already declined.
Portion size is equally significant. If the chef uses 0.350 kg of chicken instead of 0.300 kg, each portion costs an additional 0.050 × 9.00 = 0.45 AZN. Food cost again reaches 33.3%. At 600 portions a month, this amounts to a loss of 270 AZN on a single dish.
Actual versus theoretical cost
Dish-level food cost indicates whether menu prices are set correctly. To assess what actually happens in the kitchen, two figures need to be compared:
- Theoretical cost. Portions sold × the recipe-card cost of each dish. This is the amount that would have been spent if every dish had been prepared exactly according to the recipe.
- Actual cost. Real usage based on stock movements: opening stock + purchases − closing stock.
An example for one month:
| Item | Amount (AZN) | % of food sales |
|---|---|---|
| Opening stock | 4,200 | |
| Purchases (per invoices) | 11,800 | |
| Closing stock (per count) | 3,600 | |
| Actual usage (4,200 + 11,800 − 3,600) | 12,400 | 31.0% |
| Food sales | 40,000 | 100% |
| Theoretical cost (from recipe cards) | 11,200 | 28.0% |
| Variance (losses) | 1,200 | 3.0% |
| of which: write-offs with a recorded reason | 450 | 1.1% |
| of which: unexplained variance | 750 | 1.9% |
The menu was costed at 28%, but the month closed at 31%. The difference of 1,200 AZN represents losses. Of this amount, 450 AZN was written off with a recorded reason: spoiled produce, staff meals and broken items. The remaining 750 AZN has no explanation, and this is where the investigation should begin.
The same check can be carried out for a single ingredient. Chicken: 40 kg at the start of the month, 180 kg purchased, 30 kg remaining. Actual usage is 40 + 180 − 30 = 190 kg. According to the recipe card, the 600 kebabs sold required 600 × 0.300 = 180 kg. The 10 kg gap is worth 10 × 9.00 = 90 AZN. The cause can now be investigated specifically: over-portioning, spoilage or a short delivery.
It is not necessary to check the entire storeroom at once. A small number of items usually account for most of the cost: meat, chicken, fish, cheese, butter and alcohol. Begin by comparing actual and theoretical usage for these 10-15 items. If the variance appears on the same product every month, it is not accidental. Typically, either the recipe card does not reflect actual kitchen practice, portion standards are not being followed, or there is a problem with receiving.
Some variance exists in every restaurant: scale error, tasting, trimmings left after butchering. The relevant question is not whether a variance exists, but how large it is and in which direction it is moving. If it grows from month to month, a process has broken down.
The main sources of losses
The gap between theoretical and actual cost usually arises from a number of well-known sources:
- Over-portioning. Portions are estimated by eye, scales are not used, and there are no standard ladles or plates. As the example above shows, 50 grams per plate adds up to hundreds of manats per month.
- Waste and spoilage. Expired products, improperly stored herbs and excessive preparation. If these are not written off with a reason, they end up in the unexplained variance.
- Unrecorded complimentary items. A dessert for a regular guest, staff meals, tea for acquaintances. Any item not recorded as complimentary at the register leaves the storeroom without appearing in sales.
- Theft. It is an uncomfortable subject, but it does occur. Without regular stock counts, shortages of meat, alcohol or butter are almost impossible to detect.
- Receiving errors. The invoice states 20 kg, 18 kg is delivered and nobody weighs it. You pay for 20 kg, while only 18 kg enters stock.
- Outdated prices. A supplier has raised prices, but the recipe card still shows the old cost. This is not a direct loss, but the theoretical cost no longer reflects reality.
- Bookkeeping errors. A missing invoice, a purchase entered twice, or the wrong unit of measure (box instead of kg). These are not real losses, but they distort the figures and conceal the actual problems.
Setting up inventory control
Food cost is not calculated once and then set aside. It is an ongoing business process. The following steps apply equally to a small café and to a restaurant with several branches:
- Prepare recipe cards for the entire menu. Each card should include gross weights, loss percentages and units of measure. Components used in several dishes, such as sauces and dough, should be set up as semi-finished items.
- Receive goods against purchase invoices. Every delivery is recorded with quantity, price and supplier. Weigh the goods and check them against the invoice. Configure packaging units correctly so that "1 box" is converted into the correct number of kilograms or pieces in stock.
- Record write-offs with a reason. Spoilage, expiry, breakage, staff meals. When every write-off has a reason, the unexplained variance decreases and the source of the problem becomes clear.
- Record complimentary items at the register. This keeps stock usage and sales consistent with each other.
- Conduct regular stock counts. Count expensive and perishable items weekly and all other items monthly. Always count at the same time, for example after closing.
- Document transfers. Stock moved from the main storeroom to the kitchen or bar must be recorded as a transfer. Otherwise one location will show a surplus and another a shortage.
- Record production. When a semi-finished item is prepared, the ingredients are deducted from stock and the finished item is added to it.
- Review menu prices monthly. Check the food cost of best-selling dishes and dishes with expensive ingredients. If costs have risen, adjust the price, the portion or the recipe.
Much of this can be managed in a spreadsheet. As sales volume grows, however, deducting every portion manually, updating prices and reconciling stock counts takes a considerable amount of time. For this reason, an inventory module is one of the key criteria when choosing a restaurant POS.
Inventory management in UniPOS
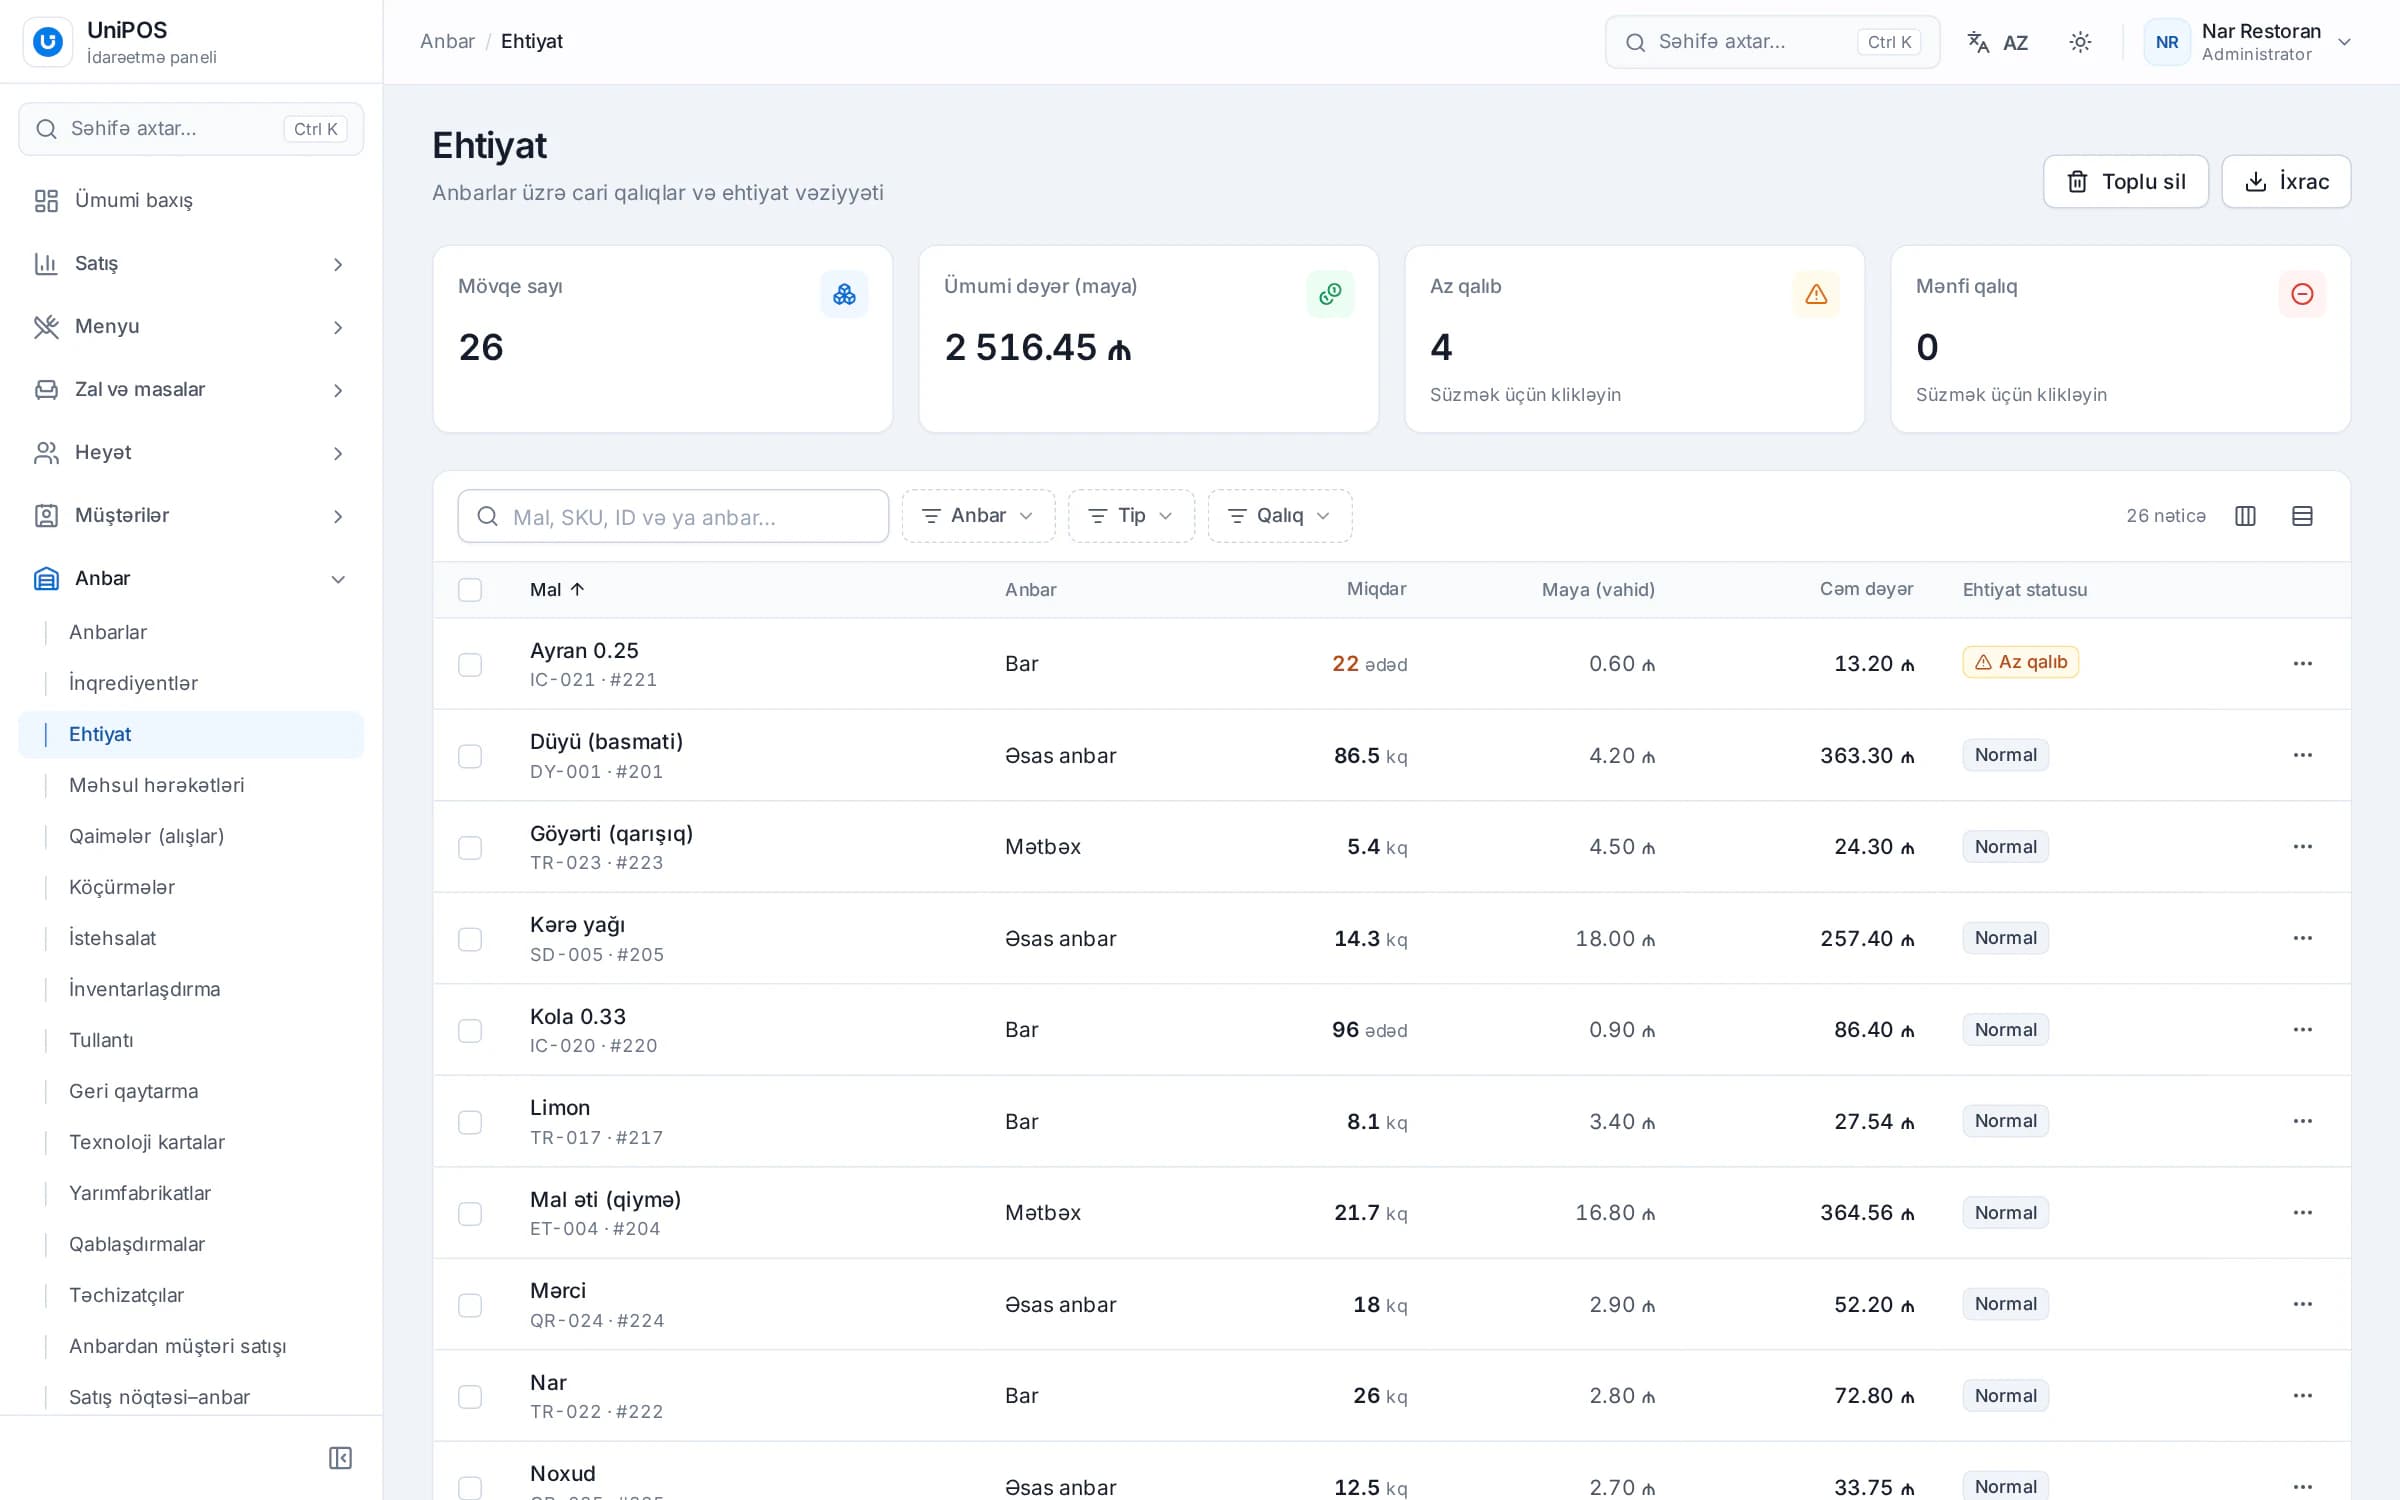
In UniPOS, inventory is not managed at the register but in the browser-based back office. The POS records sales and complimentary items, and sold items are deducted from stock according to their recipe cards. Cashiers are not involved in stock operations. The owner or storekeeper sees every stock movement in one place.
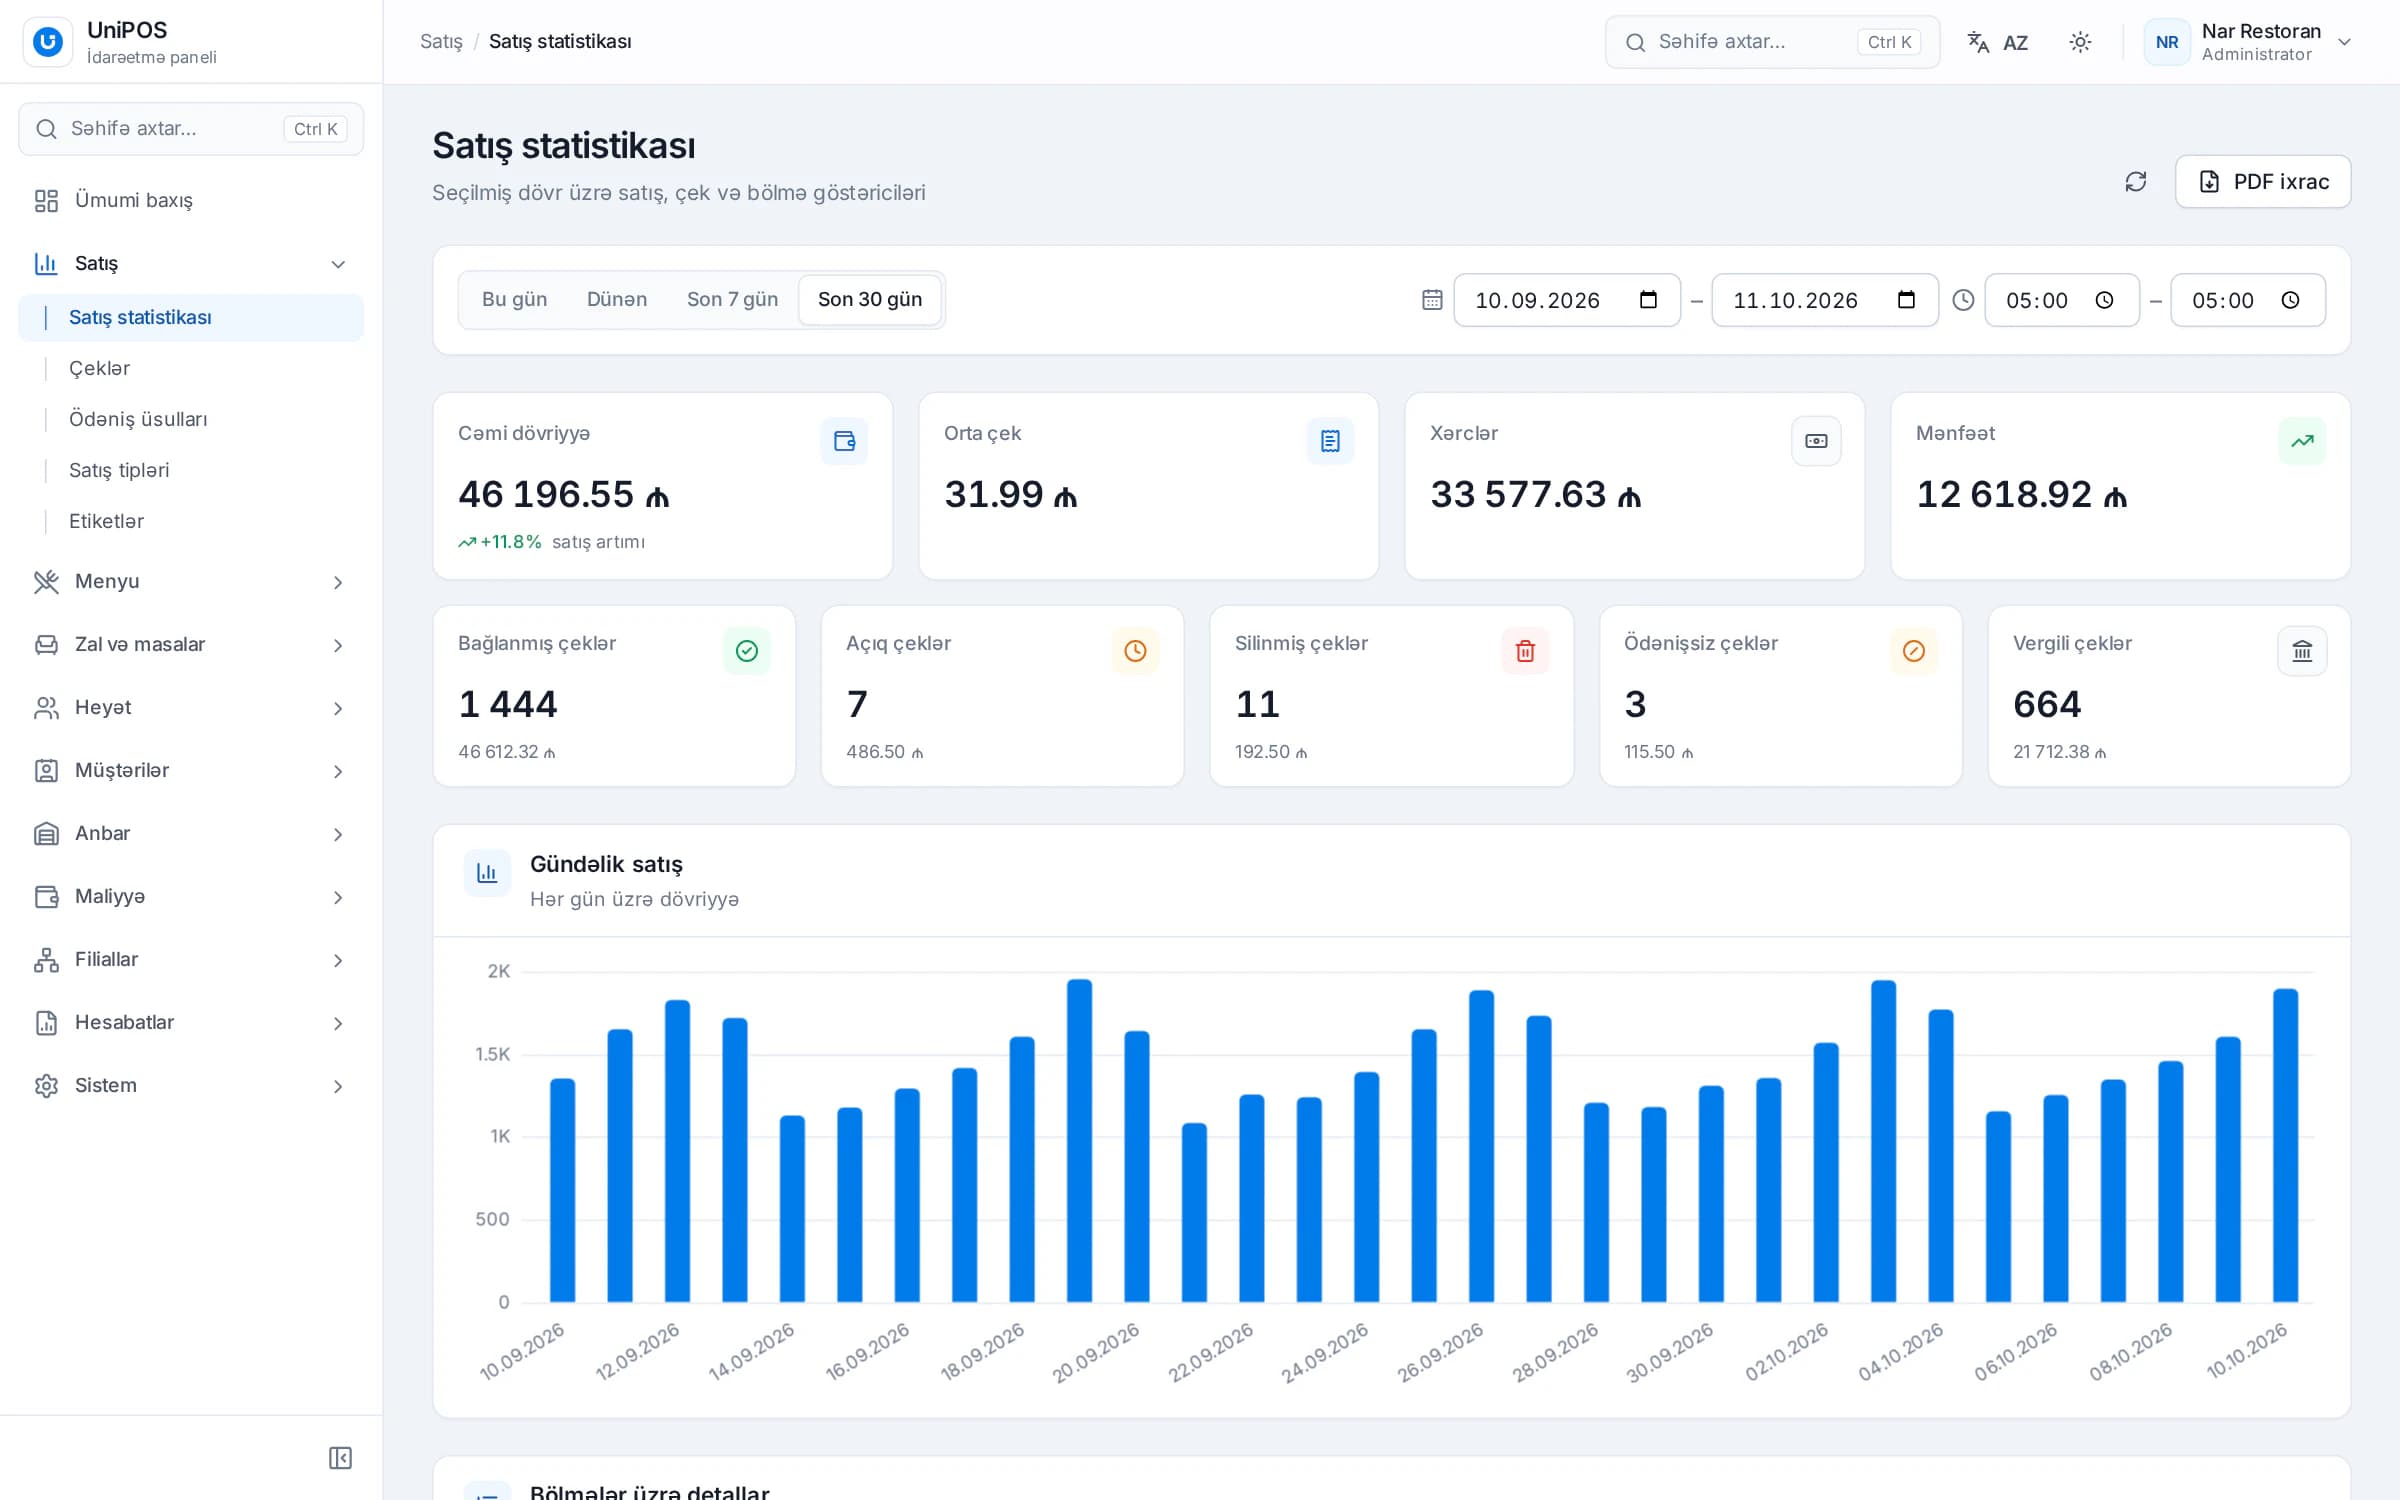
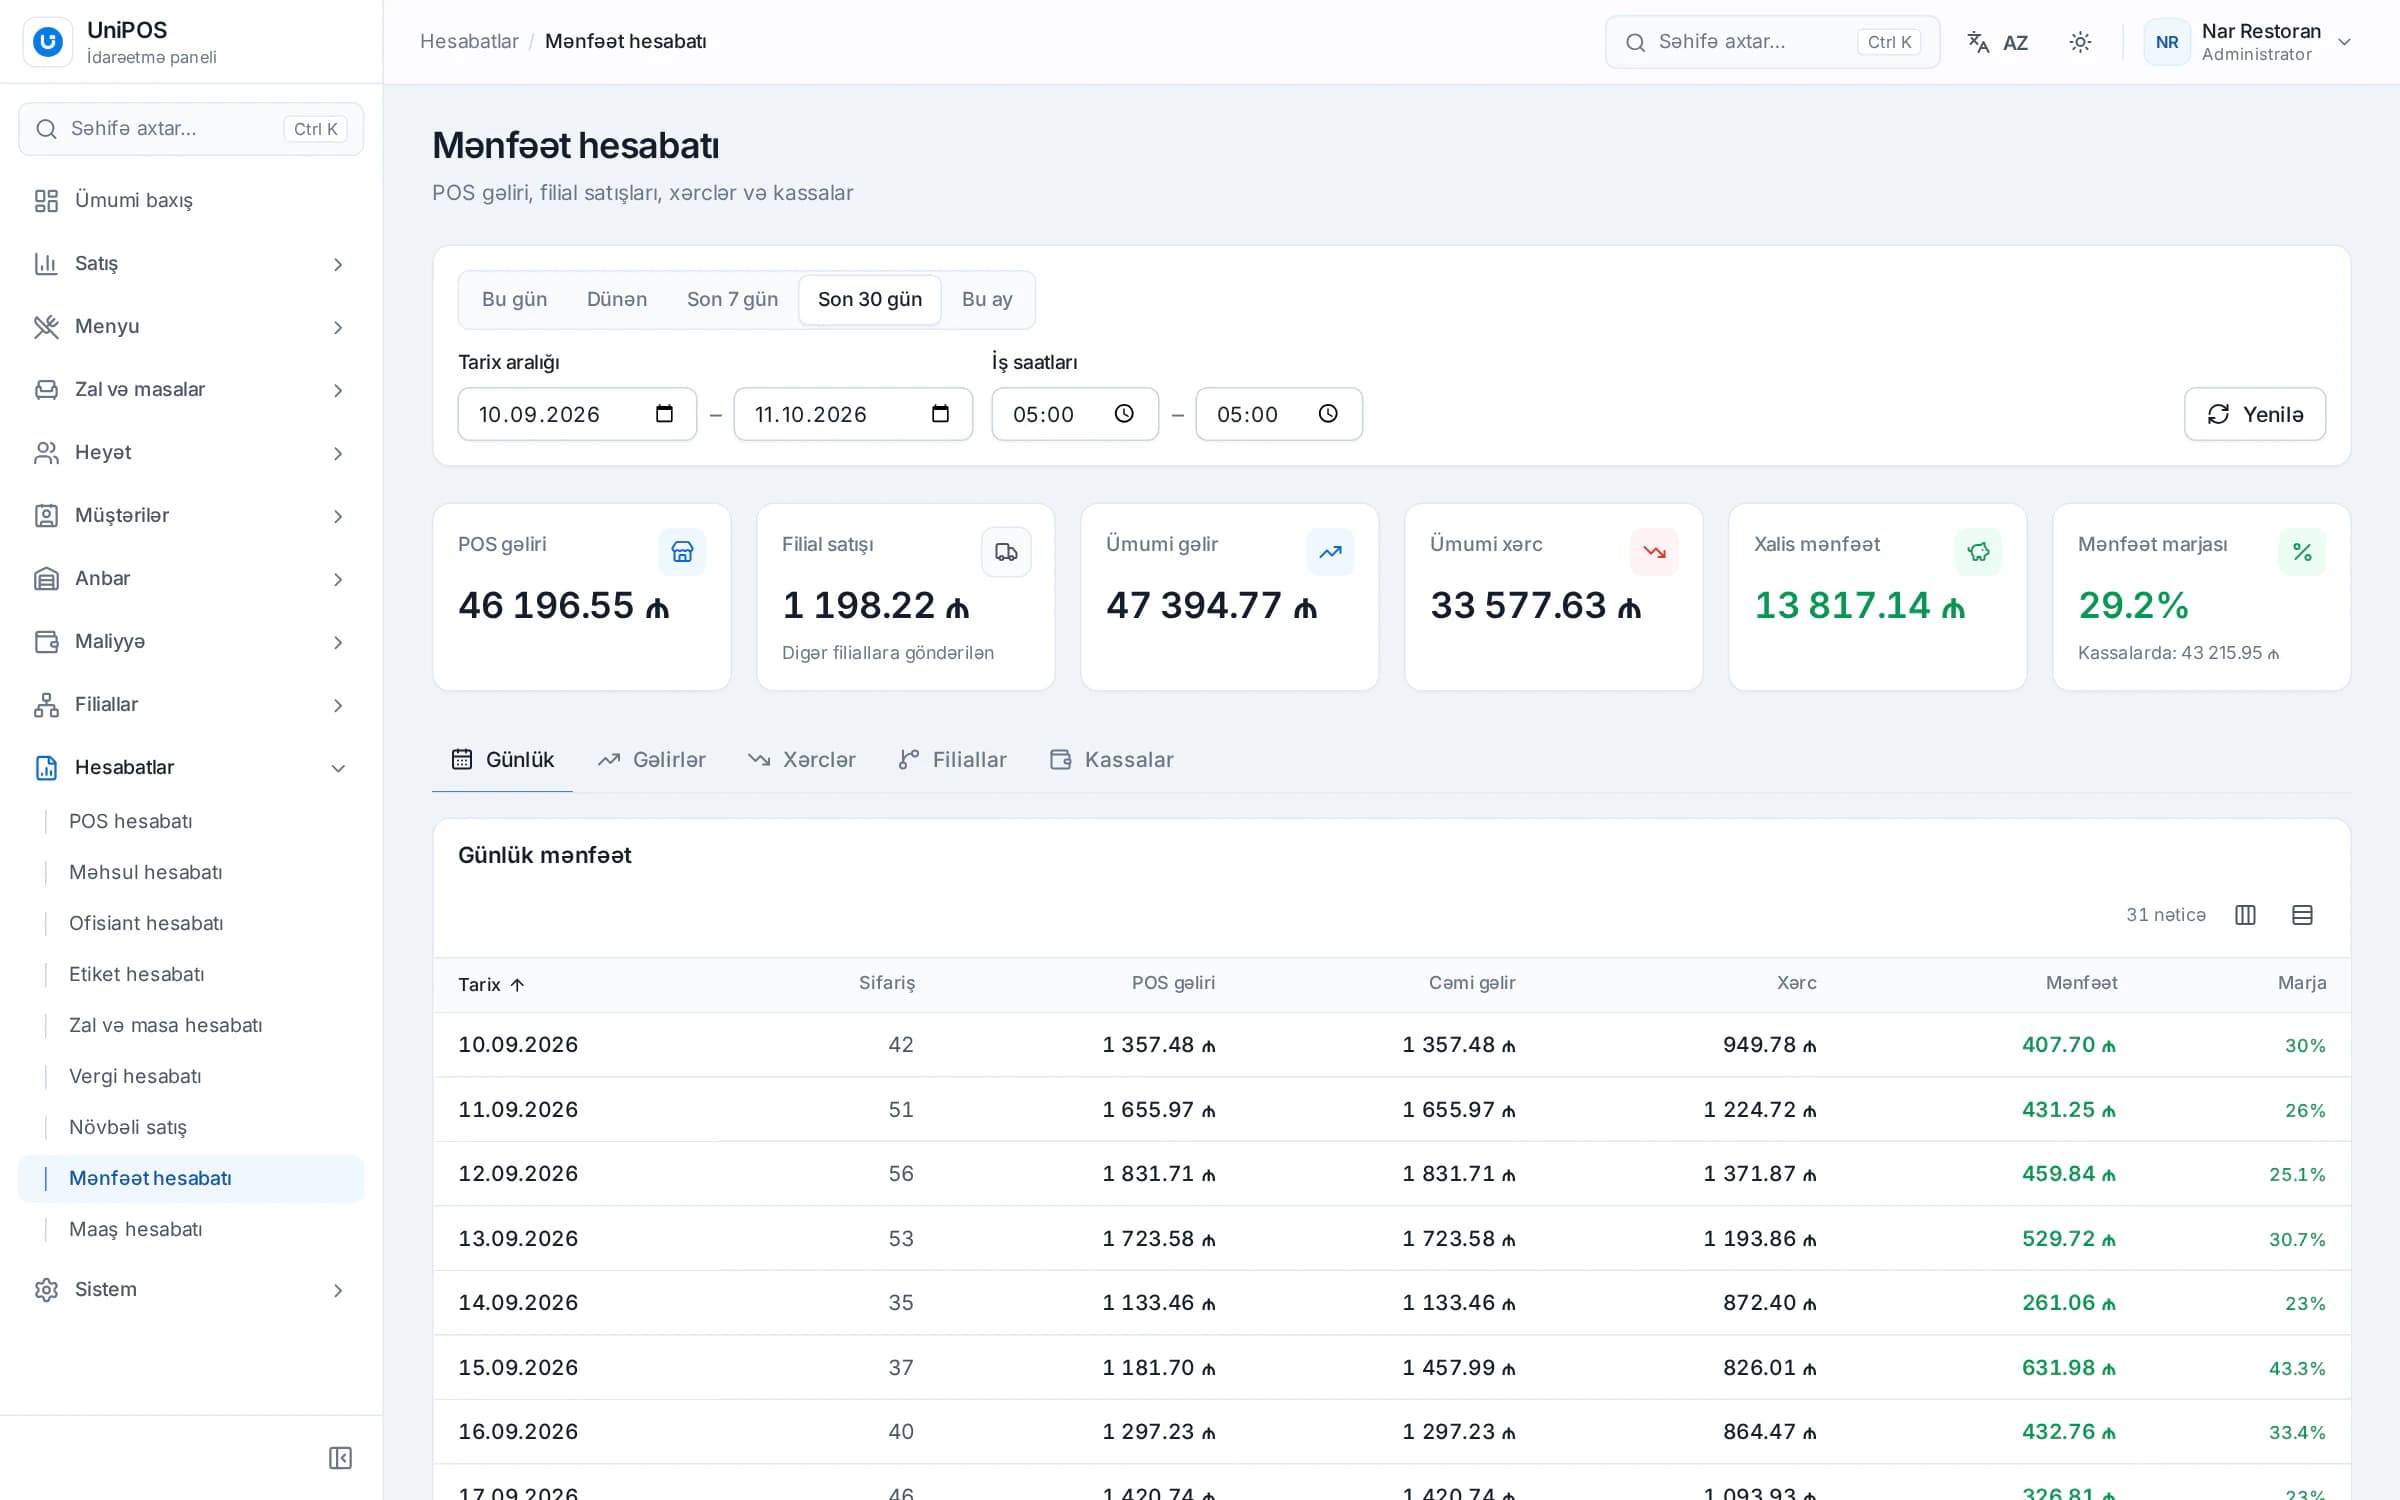
Among the reports, the recipe cost report shows which dishes have become more expensive to produce. The profit report presents income, expenses and margin together. Further details are available on the inventory page.
The UniPOS Manager app provides a full inventory section and a stock alerts widget. It also shows the real cost and margin of menu products, calculated from recipe cards and purchase prices, and highlights items sold at a loss. This allows you to monitor stock levels and costs without being on site.
UniPOS Manager (Android) also offers an AI assistant as a separately enabled module. You can ask about stock levels, including which items are running out, as well as sales and expenses, by text or by voice, for example "Which items are running low?". The assistant is read-only: it analyses and explains the data but does not change anything, and key figures should still be verified in the reports. In addition, a Telegram briefing with key figures, items that require attention and a recommendation can be sent every morning and at the end of the day, with separate report types for the manager, the stock keeper and the accountant.
Your food cost in figures
During a demo, we will build recipe cards for several of your dishes in UniPOS together with you and show how inventory control works on a real example.
Request a free demo